It's all in the name
Datacadabra "the company and the name" were born out of the realization that in the 21st century there is an enormous amount of data available. Also known as big data. It results from the development that at more and more places and times, more and more data is captured and available. Its sources are diverse and the data can be both structured and unstructured. Companies and governments also have more and more information available and can extract many insights from it. But, many organizations don't know how to make this massive amount of information actionable. And that's where we come to the rescue!
Generating Insights
From the immense amounts of data, algorithms allow computers to filter and use information at an ever faster rate. The connections that are made between different types of information can be used to provide insight into market opportunities, customer behavior and industry developments. But also in social, economic, financial, commercial or political trends. It is good to see that making decisions based on data is becoming more and more commonplace within the Dutch business world. Do you also want to base your decisions more and more on data? We can help you lead the way.
How we apply this
You now know more about the reason for founding Datacadabra. In addition, you know that insights can be generated with the ever-increasing amount of information. But, how do you arrive at those insights?
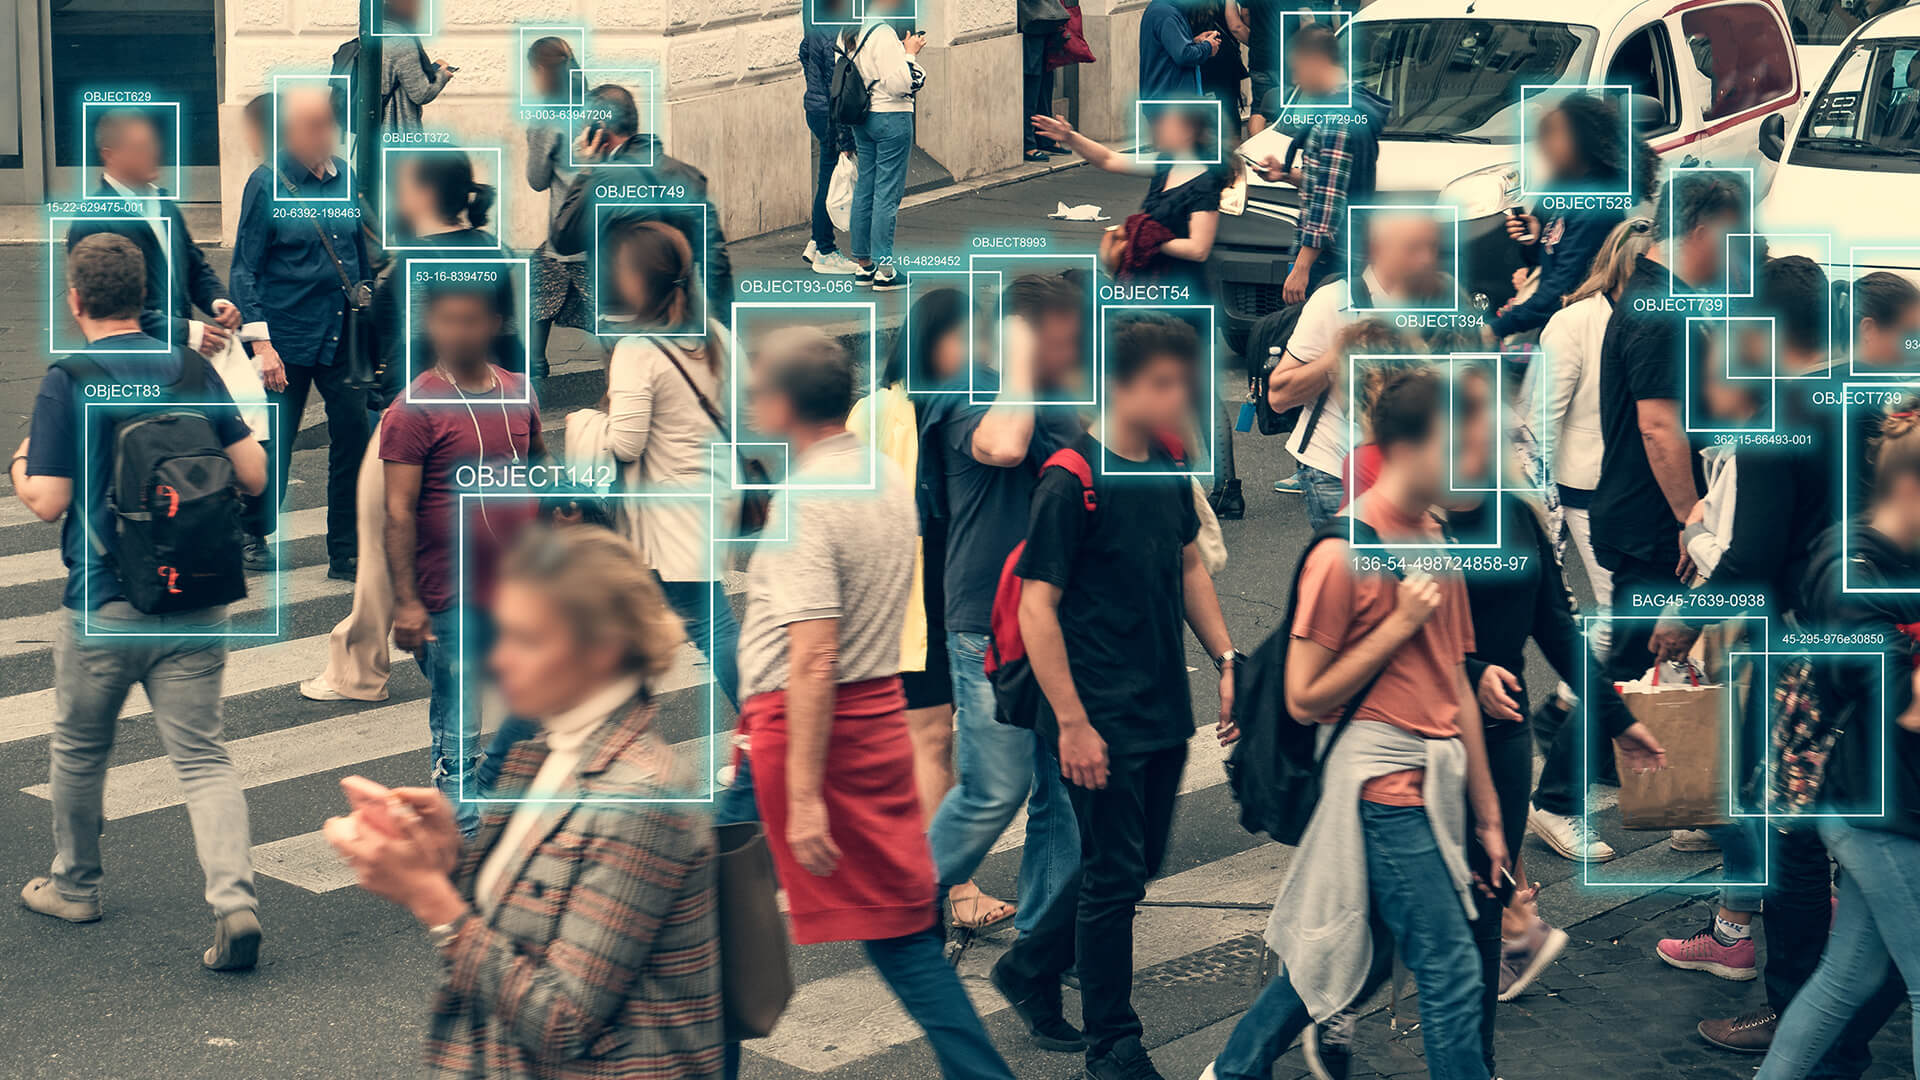
We can ensure that available data is analyzed automatically. We do this by applying artificial intelligence. Algorithms are let loose on large amounts of data and extract interesting relationships, similarities, differences and trends. This can be done in many different ways, for example by computer vision or machine learning. In our previous blog, we discussed what deep learning entails, a component of machine learning.
Sample case: The MowHawk
Okay, sounds logical all around. But how does it work in practice? For that we take you through the process of one of our clients. In response to a request from the Province of Overijssel, The MowHawk (www.mowhawk.nl) was developed. Simply described, it is a camera system attached to the cutter bar of a roadside mower. The camera pulls in real-time images (data) while mowing the roadsides. At the same time, algorithms are unleashed on these images and the computer recognizes specific characteristics such as shape, size or color. The computer identifies the features and when it has a specific composition, it recognizes it as a particular object, for example, a can of drink (litter). In this way, real-time information can be given to the driver about whether and where there is litter in the roadside clippings. Decisions can be made based on that information. For example, the section of roadside that contains litter is not mowed because we do not want to mow litter: polluted grass clippings cannot be recycled. So in this way, policy can be implemented more efficiently. The computer has learned that when identifying these characteristics, it recognizes it as a particular object, for example, a can of drink (litter). In this way, the driver can be informed in real time whether and where there is litter in the roadside grass. Decisions can be made based on that information. For example, the section of roadside that contains litter is not mowed, because we do not want to mow litter: polluted grass clippings cannot be recycled. On the way to a more efficient policy!